When train and tram wheels brake unevenly the result is often wheel flats. Resulting wheel slides cost the industry millions of pounds in engineering costs and delays each year.
UK Railway Group Standard GM/RT2466 requires that wheel flats larger than 60mm on vehicles operating at speeds up to and including 200km/h (125mph) have to be returned to depots immediately – at greatly reduced speeds. For 40-60mm flats, a vehicle has to be returned to the depot within 24 hours of discovery of the fault.
Meanwhile, in the UK it is estimated that the issue of slippery rails and reduced adhesion caused by falling autumn leaves cost the industry GBP60m (EUR67.5m) a year.
Wheel slides are directly impacted by a multitude of events, including service performance, weather conditions, time of year, vehicle condition, track quality, track cleaning approaches, leaf-fall data, level crossing proximity, driving policies and more. The issue has also resulted in several serious rail safety incidents in recent years.
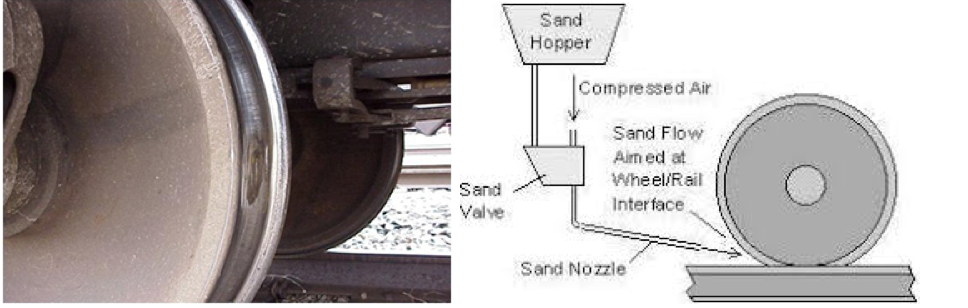
A Typical Wheel Flat and Sanding
Although it is recognised that there are many potential causes for wheel slide, and data needs to be acquired from a wide range of sources, the current approach to analysis is to simply use each individual data source, essentially in isolation. However if all the sources were examined in unison, using the power of Big Data analytics, it is probable that the industry would not only identify the major contributions more effectively and efficiently, but it would also probably make important discoveries of problem areas that would otherwise remain hidden.
Through ‘Knowledge Discovery from Data’ (KDD), there is a potential saving of millions. Over the last few years there has been significant anticipation associated with the use of Big Data techniques for the analysis of rail-related data; however the major expectations have yet to be fully realised and we are currently performing an analysis of real-time train data to prove the technique.
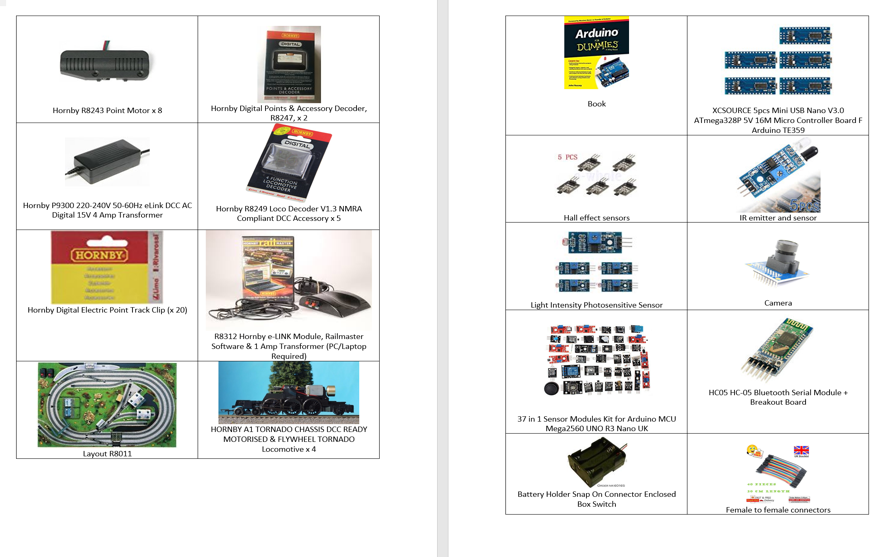
For this project we have used in-service data that includes GPS positioning, braking and power application, dwell times, information on wheel slide, sanding application, speed, acceleration and more. It predicts when a train or tram is most at risk from sliding, when the driver needs to be warned and when sand needs to be applied to stop wheel slides. By reducing the number of alerts and optimising the use of sand, the rail system will be subject to reduced delays and damage.
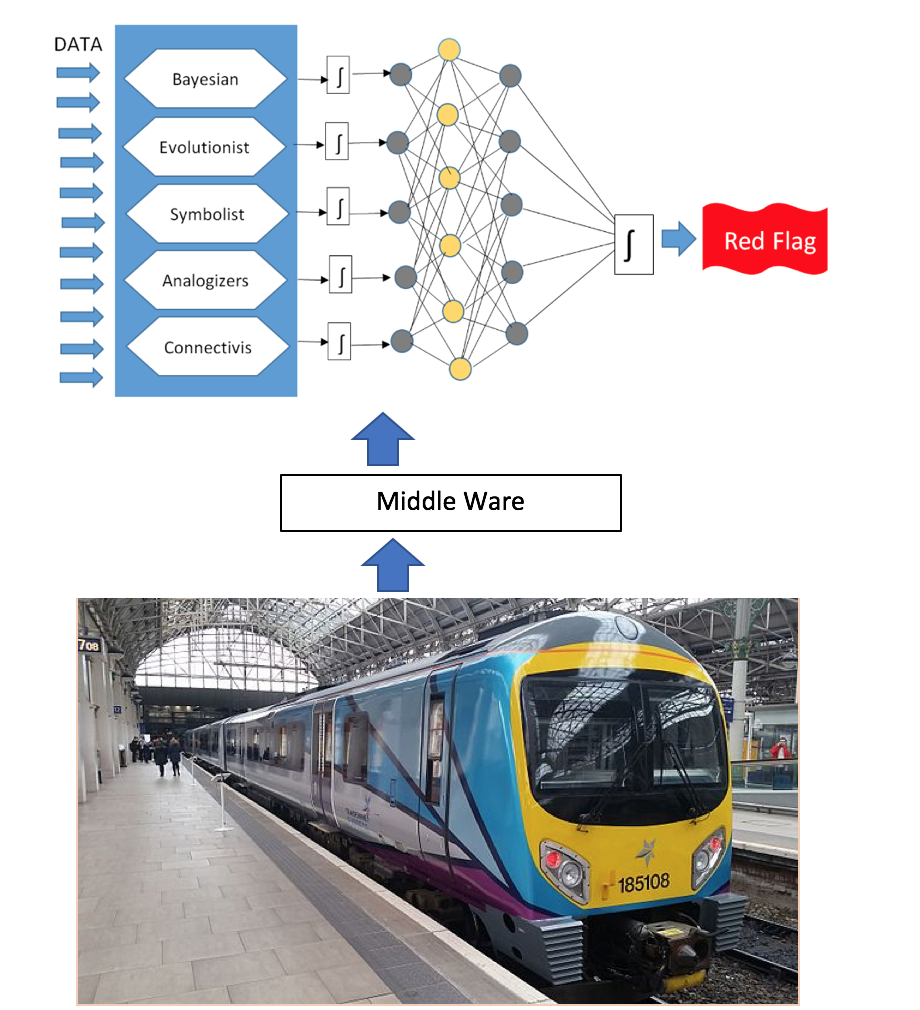
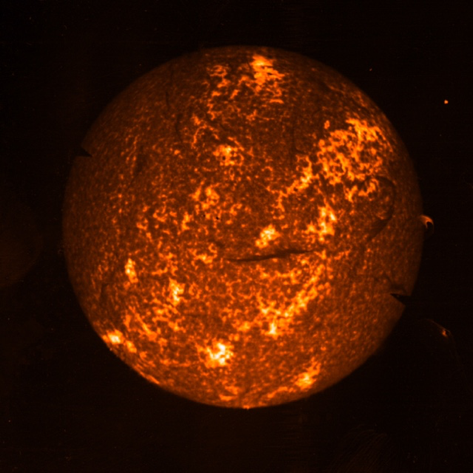
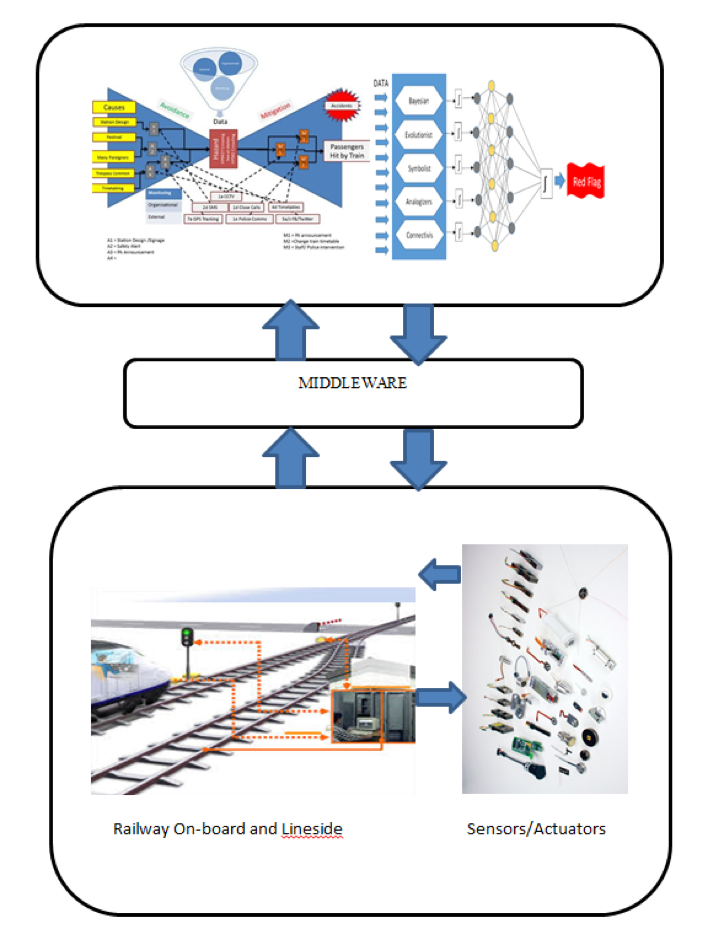
We are currently looking to apply the techniques that have been used in the prediction of solar flares to ‘multi-variable’ analysis of rail problems. We are working closely with a team from Georgia State University (GSU), one of the leaders in the emerging field of data science, who have recently made significant advances in big data analytics related to prediction of solar flares that we believe can be directly applied to complex rail problems. The GSU techniques are based on the combination of decision trees and deep neural networks feeding off multiple data streams.
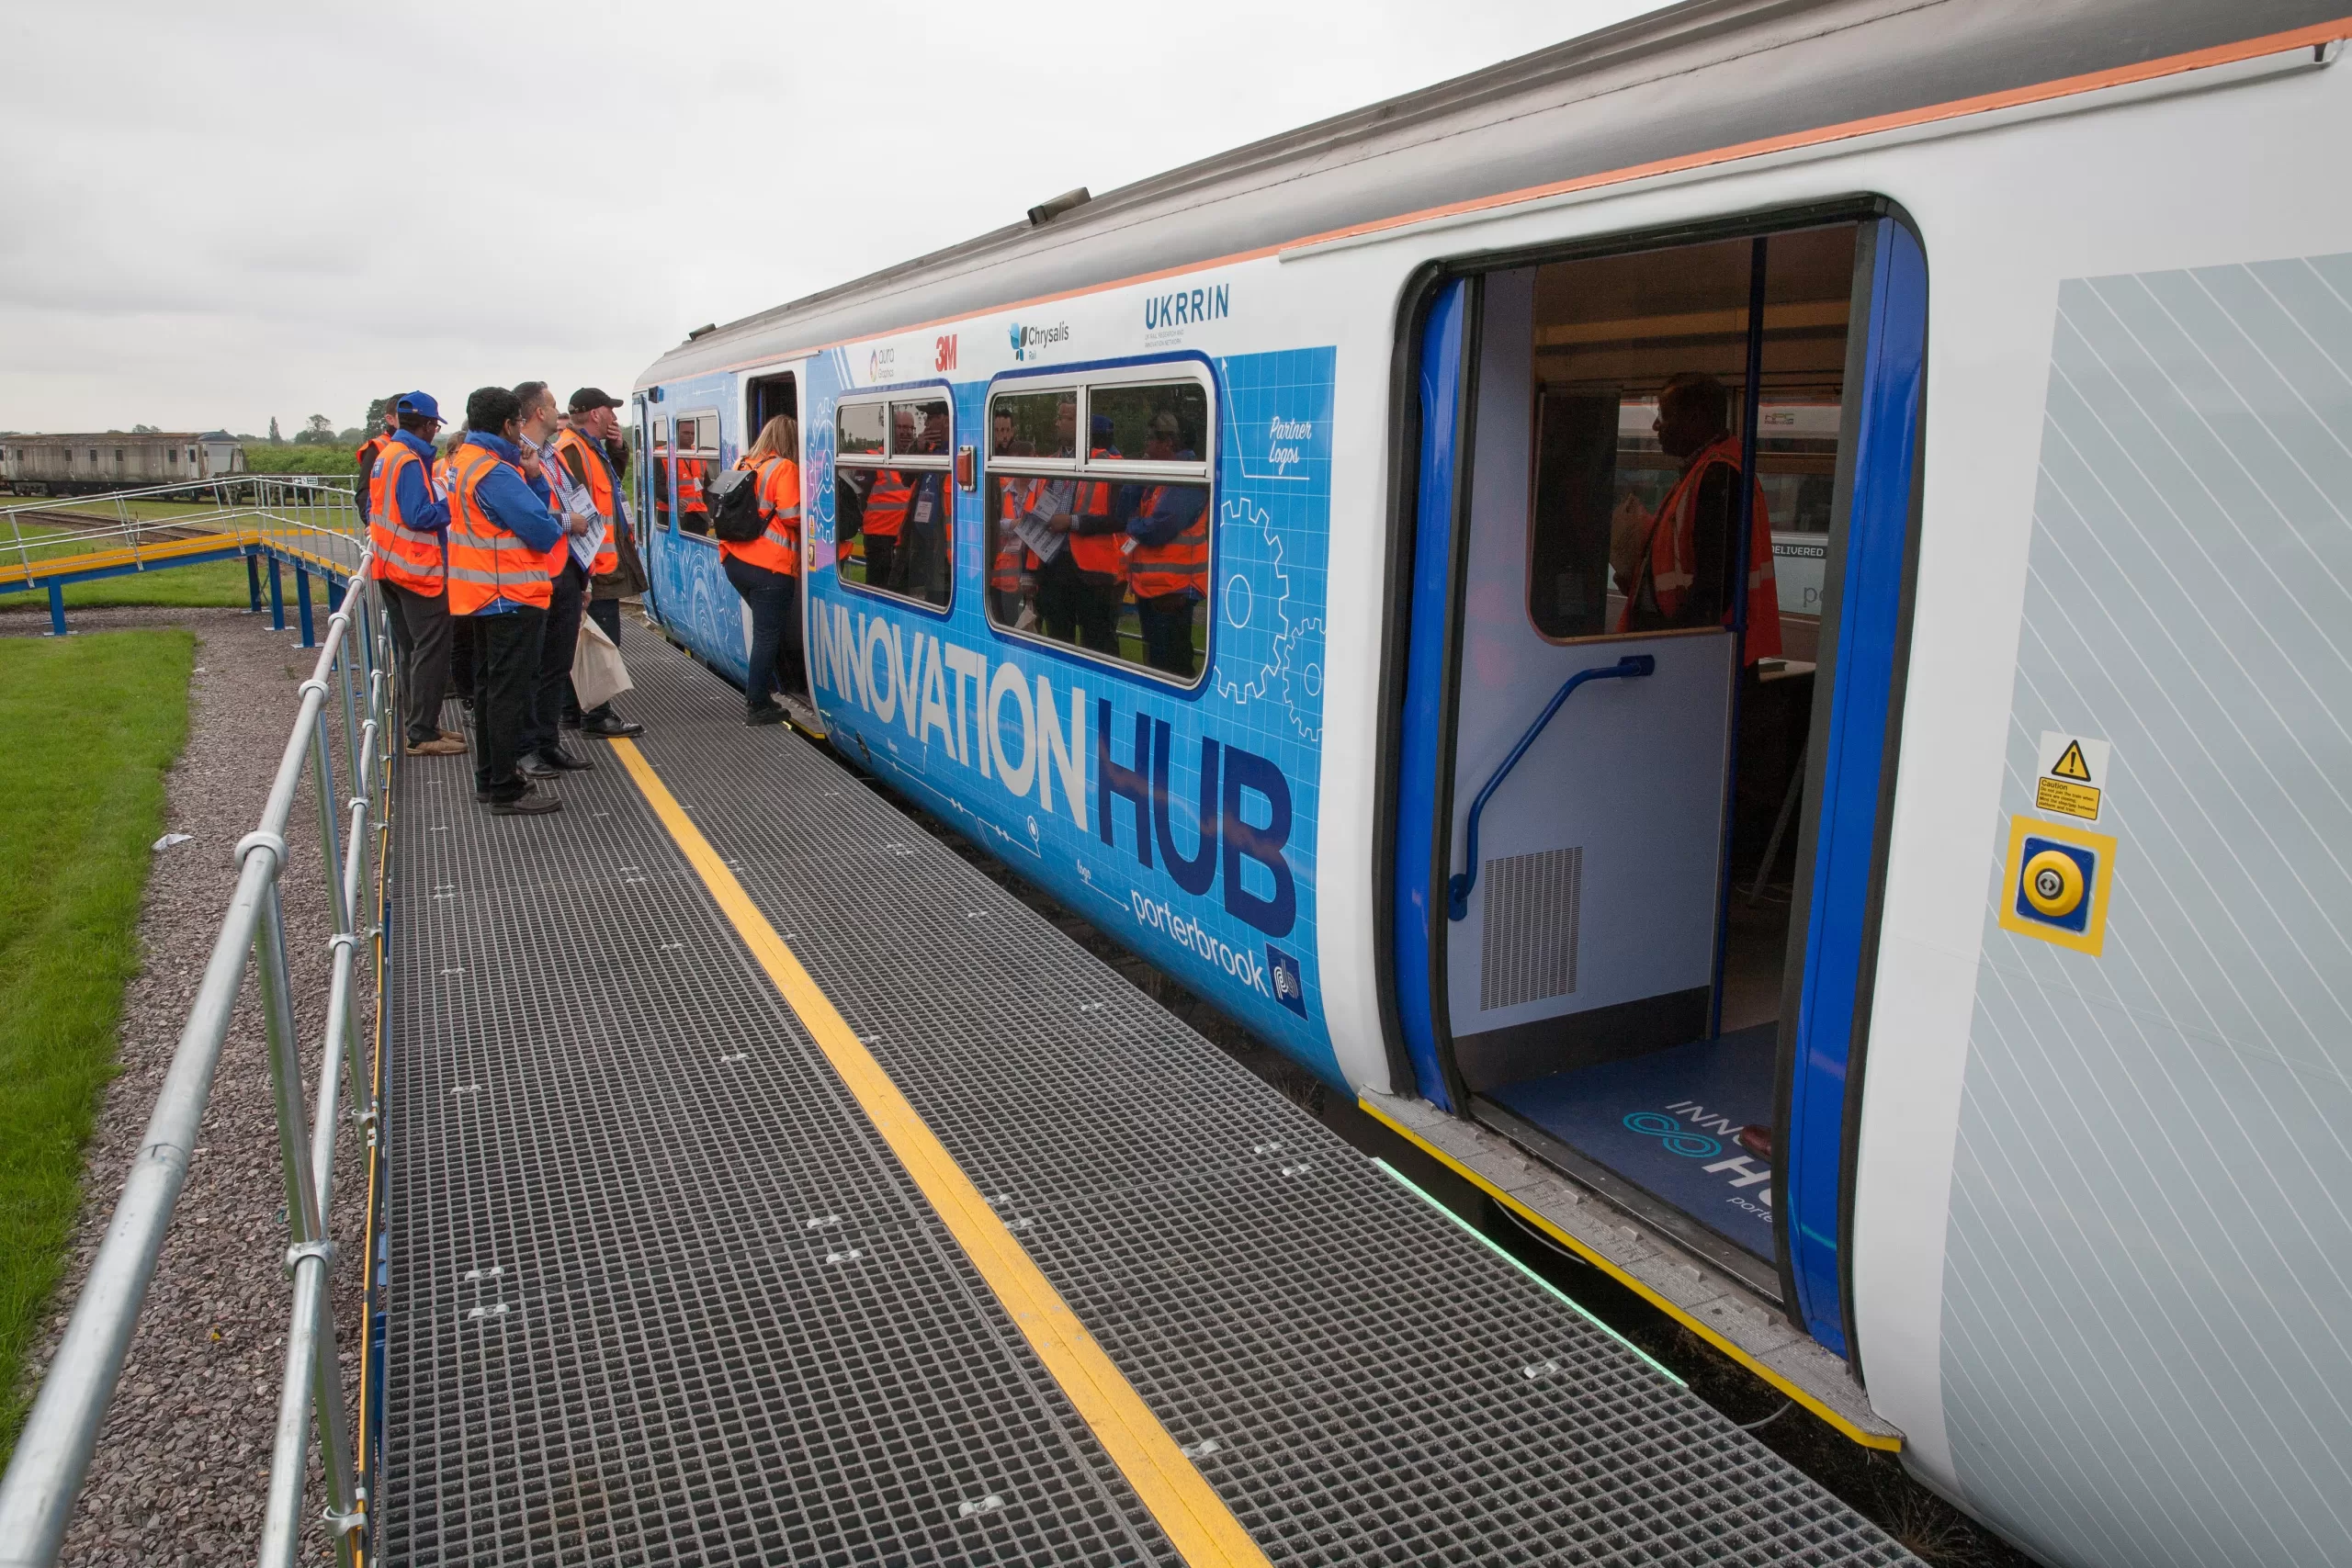
This multi-data stream approach to prediction fits well with our ELBowTie© risk analysis methodology. Over the coming months we will be setting up analysis of real time train data to prove the technique. Siemens Train care in Manchester are responsible for maintaining the Siemens Desiro diesel multiple Unit fleet .
For this project there will be supplied in service data from the train including train position (from GPS) braking and power data, station dwell data, wheel slide data, sanding application data, speed, acceleration and so on. We will use this data to attempt to predict when the train is most at risk from sliding and when the driver needs to be warned and when sand needs to be supplied to stop wheel slides. By reducing the number of alerts and optimising the use of sand, the system will be less subject to delays and damage from wheel flats.